Platform ecosystems (5): Ecosystem value mapping
This is part five of seven blogs on platform ecosystems. All blogs can be found on Blogs – Organizational Revolution
How to design and analyse your platform ecosystem? One of the most useful tools for doing this is creating an ecosystem value map. The first time I saw this approach was in the book Digital Capital by Lowy, Ticoll and Tapscott dating from 2000(!), but maybe there are earlier sources. It struck me immediately as a valuable way of looking at complex constellations of businesses. However, it took a long time before companies started to think on an ecosystem level. Therefore the use of value maps took some time to get of the ground. Now, we’re there. Value maps have become indispensable for ecosystem management.
So what is an ecosystem value map?
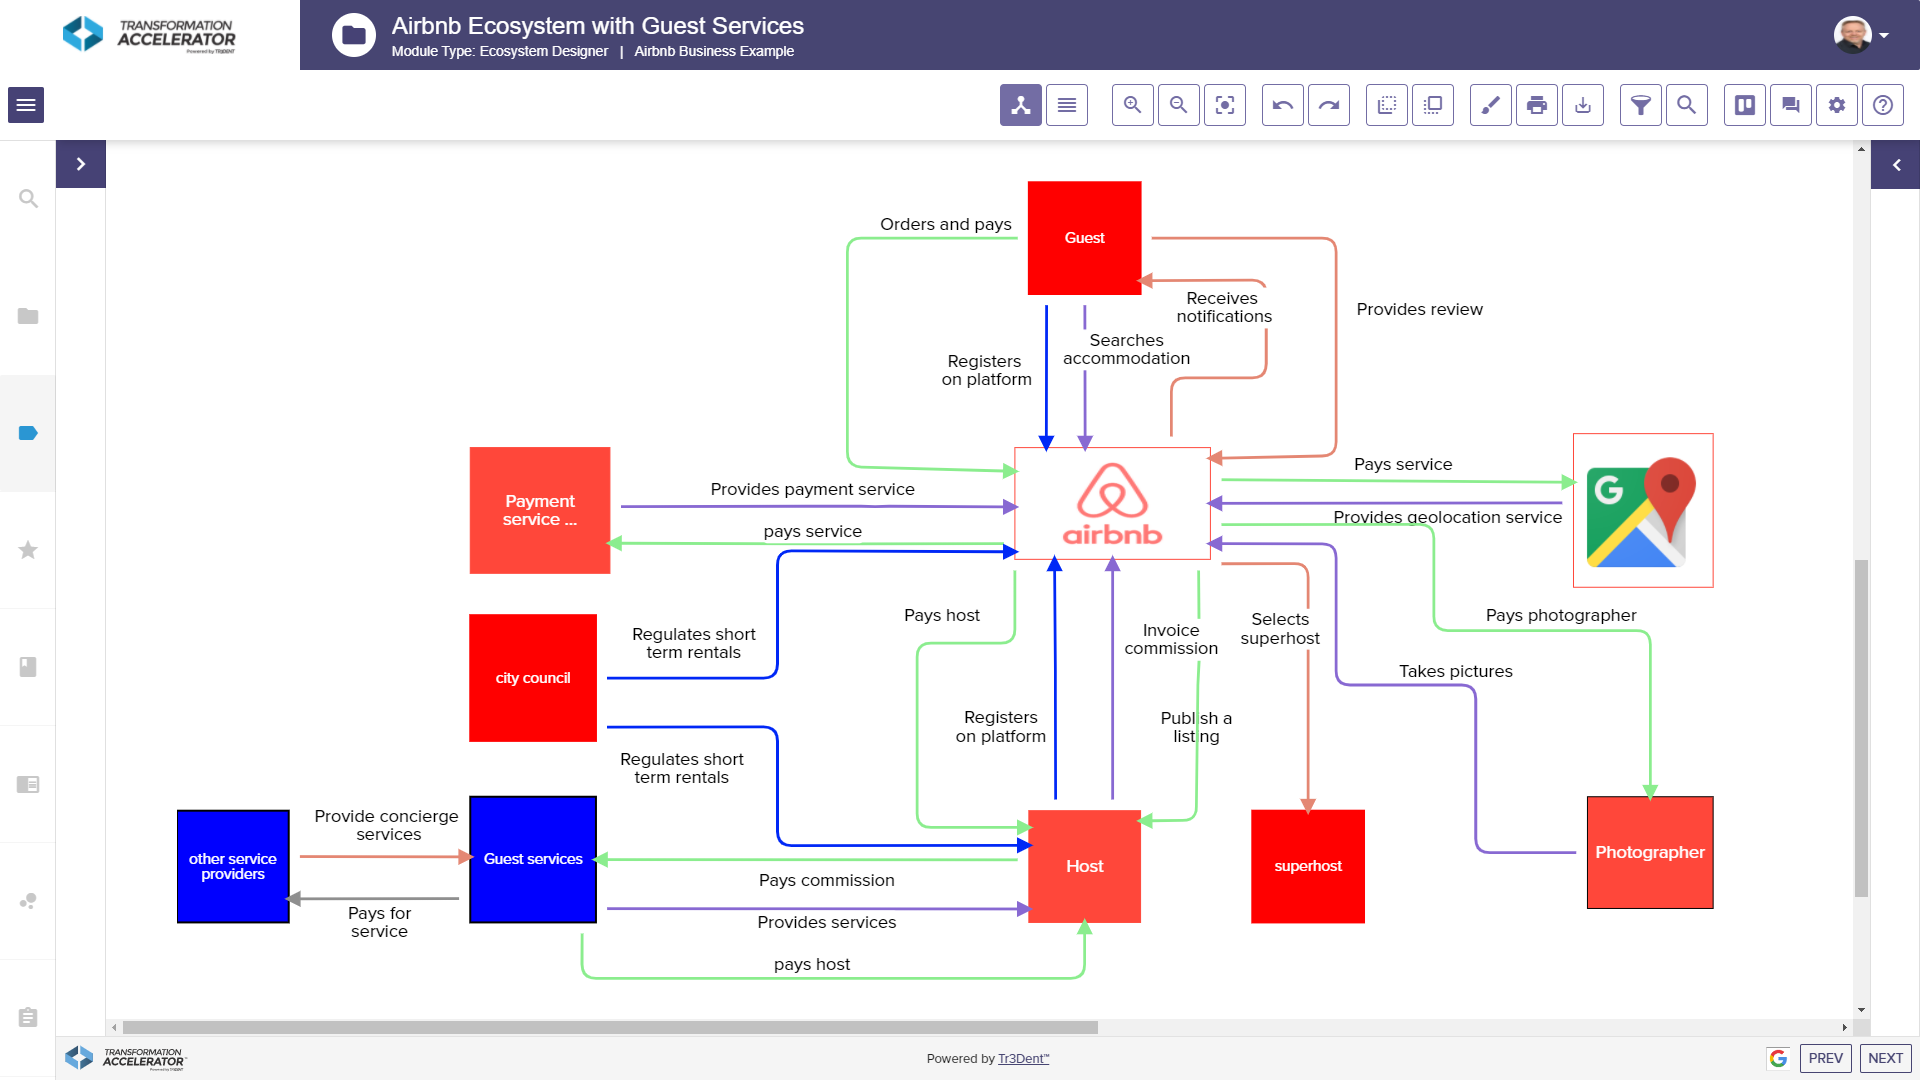
The figure below gives an example of AirBnb’s ecosystem map around guest services, provided by www.tr3dent.com whose Transformation Accelerator offers the capability to make these maps. The figure depicts the most important parties that are active in the ecosystem and the relations between them. It also indicates what the sources of value are that flow between the various parties. Value includes not only financial value, but also data, services, information, knowledge, or regulation. The different line colours indicate these different types of value.
Benefits of ecosystem value maps
Such value maps help to create an overview of ecosystems. Visualization of ecosystems has a number of benefits:
- You learn to understand how the ecosystem works, how it generates value and for which parties. This is important because you need to understand how you and your partners can benefit from the ecosystem;
- It creates alignment within your company around your vision on the ecosystem. Value maps are a great tool to communicate. A picture says more than a thousand words. In addition, the process of making a value map will lead to valuable discussions within your organization.
- You can add partners or relationships and thereby spot new opportunities for value creation or value appropriation;
- It is easier to construct different ‘what if…’ scenario’s based on the visualization and thereby learn how your ecosystem may evolve. As ecosystems are dynamic your control points in the ecosystem may change over time. Therefore it is necessary to analyse a couple of scenarios;
- It helps you understand indirect flows of value creation. Spotting indirect flows of value creation is an important skill in ecosystems. An investment in partner X may not benefit you directly, but through effects on partner Y. For example, people don’t pay Facebook anything for using the Facebook site, but advertisers pay for the data people generate. Another example is the Dutch ecosystem around tax and wages. By investing in the relationship with developers of software for salary administration, the software improves and companies using that software are able to file taxes faster and with fewer mistakes. The tax agency does not benefit directly from collaboration with software developers, but the indirect benefits generated by the clients of the software developers are huge. Such indirect value flows are much easier to identify with a value map in front of you.
Even more fun is to be had when you invite stakeholders to make the ecosystem map together with you. This will make the system more complete, helps you to align your stakeholders around your platform and in my experience it also leads to the generation of many new ideas.
What does your value map look like?
About this series
In a series of seven blogs I give my view on the ins and outs of managing platform ecosystems. I will discuss the four challenges of managing platform ecosystems, what companies do to overcome the challenges, a model for the governance of platform ecosystems, modelling ecosystems through value maps, how value proposition based ecosystems relate to platform ecosystems and when to opt for a closed or open ecosystem.